Windows Performance Monitor is a powerful system monitoring tool included with Windows 8 that allows users to analyze and monitor the performance of their computer in real-time. Performance Monitor provides detailed insights into various system resources, including CPU usage, memory usage, disk activity, network activity, and more. With Performance Monitor, users can track performance metrics, identify bottlenecks, diagnose issues, and optimize system performance effectively. In this comprehensive guide, we’ll explore everything you need to know about using Windows Performance Monitor in Windows 8, from accessing the tool to creating custom performance counters and interpreting performance data accurately.
Understanding Windows Performance Monitor:
Windows Performance Monitor, also known as PerfMon, is a versatile system monitoring tool that provides real-time performance data and insights into the operation of your computer. It allows users to monitor a wide range of performance metrics and system resources, providing valuable information for diagnosing issues, optimizing performance, and troubleshooting problems effectively. Performance Monitor is particularly useful for system administrators, IT professionals, and power users who need to analyze and manage the performance of Windows-based computers.
Accessing Windows Performance Monitor:
To access Windows Performance Monitor in Windows 8, follow these steps:
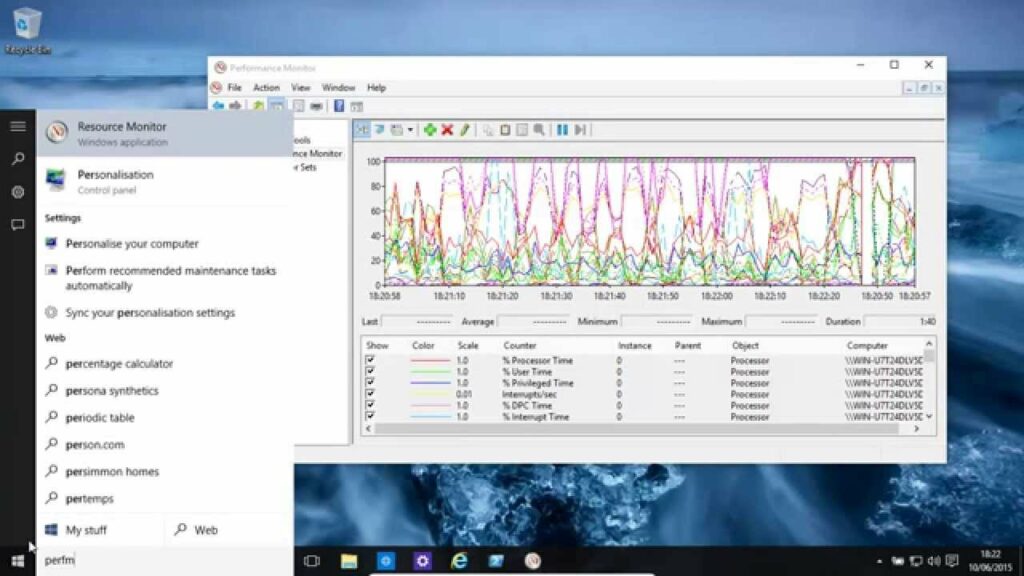
- Open Performance Monitor: Press the Windows key to open the Start menu, then type “Performance Monitor” in the search bar. Click or tap on “Performance Monitor” in the search results to launch the application.
- Alternative Method: You can also access Performance Monitor by pressing the Windows key + R to open the Run dialog, then typing “perfmon” and pressing Enter.
Using Windows Performance Monitor:
Once you’ve launched Performance Monitor, you can start monitoring system performance and collecting performance data. Here are some key features and functions of Performance Monitor:
- Add Counters: Performance Monitor allows you to add performance counters to monitor various aspects of system performance. Click or tap on the “+” button to add counters for CPU usage, memory usage, disk activity, network activity, and more.
- View Performance Data: Performance Monitor displays performance data in real-time, allowing you to track performance metrics and system resources as they change over time. Data is presented graphically, making it easy to visualize trends and patterns.
- Create Data Logs: Performance Monitor allows you to create data logs to record performance data over time. You can specify the performance counters to include in the log, the sampling interval, and the duration of the logging session.
- Generate Reports: Performance Monitor can generate detailed reports based on the collected performance data. Reports provide insights into system performance, identify bottlenecks, and highlight areas for improvement.
Interpreting Performance Data:
Interpreting performance data collected by Performance Monitor requires an understanding of the performance counters and metrics being monitored. Here are some common performance counters and what they represent:
- Processor: CPU-related performance counters track processor utilization, including overall CPU usage, individual CPU core usage, and interrupt processing time.
- Memory: Memory-related performance counters track memory usage, including available memory, page file usage, and cache usage.
- Disk: Disk-related performance counters track disk activity, including disk reads, disk writes, disk queue length, and disk latency.
- Network: Network-related performance counters track network activity, including network bandwidth usage, network latency, and network errors.
Customizing Performance Monitor:
Performance Monitor allows users to customize the tool to meet their specific monitoring needs. Here are some customization options available in Performance Monitor:
- Create Custom Data Collectors: Performance Monitor allows you to create custom Data Collector Sets to collect performance data for specific purposes. You can specify the performance counters to include, the sampling interval, and the duration of the data collection session.
- Set Alerts: Performance Monitor allows you to set alerts based on performance thresholds. You can configure alerts to trigger when performance metrics exceed specified thresholds, helping you identify and respond to performance issues proactively.
- View Historical Data: Performance Monitor allows you to view historical performance data collected from data logs. You can analyze historical data to identify trends, patterns, and anomalies in system performance over time.
Troubleshooting and Optimization:
Performance Monitor is a valuable tool for troubleshooting performance issues and optimizing system performance in Windows 8. Here are some common uses for Performance Monitor in troubleshooting and optimization:
- Identify Bottlenecks: Use Performance Monitor to identify performance bottlenecks and pinpoint the root cause of performance issues. Analyze performance data to determine which system resources are being utilized most heavily and where optimization is needed.
- Optimize Resource Usage: Use Performance Monitor to optimize resource usage and improve system performance. Identify processes and applications that are consuming excessive CPU, memory, disk, or network resources and take action to optimize their usage.
- Monitor Application Performance: Use Performance Monitor to monitor the performance of specific applications and services running on your computer. Track performance metrics related to application response time, throughput, and resource usage to ensure optimal performance.
- Troubleshoot System Crashes: Use Performance Monitor to troubleshoot system crashes and stability issues. Monitor performance metrics leading up to a crash to identify potential causes and address underlying issues to prevent future crashes.
Best Practices and Considerations:
When using Performance Monitor, it’s important to follow best practices and consider the following:
- Focus on Relevant Counters: Focus on monitoring performance counters that are relevant to the specific issues you’re troubleshooting or optimizing. Avoid collecting unnecessary data that could overwhelm the system or obscure meaningful insights.
- Monitor Consistently: Monitor system performance consistently over time to identify trends and patterns. Regular monitoring allows you to detect changes in performance and address issues before they escalate into major problems.
- Document Findings: Document your findings and observations when using Performance Monitor for troubleshooting and optimization. Keep detailed records of performance data, analysis, and actions taken to track progress and ensure accountability.
- Stay Informed: Stay informed about best practices and new developments in performance monitoring and optimization. Keep abreast of industry trends, emerging technologies, and updates to Performance Monitor to maximize its effectiveness.
Conclusion:
Windows Performance Monitor is a powerful tool for monitoring and optimizing system performance in Windows 8. By providing real-time insights into CPU usage, memory usage, disk activity, network activity, and more, Performance Monitor enables users to analyze performance metrics, identify bottlenecks, diagnose issues, and optimize system performance effectively. Whether you’re troubleshooting performance issues, optimizing resource usage, or monitoring application performance, Performance Monitor provides the tools and features you need to achieve your goals. By understanding how to access and use Performance Monitor effectively, users can ensure that their computers remain efficient, responsive, and reliable in all situations. With Windows Performance Monitor, optimizing system performance has never been easier or more accessible, empowering users to maximize the performance and efficiency of their Windows-based computers.