Decoding Visual Data: A Comprehensive Guide on How to Read and Understand Image Histograms in Photoshop
Introduction:
Adobe Photoshop, a cornerstone in digital image editing, offers a myriad of tools to enhance and manipulate visual content. Among these tools, the image histogram stands as a powerful visual representation of a photograph’s tonal distribution. In this extensive guide, we will embark on a journey to decode the intricacies of image histograms in Photoshop, unraveling the information they hold and empowering users to make informed decisions in their image editing endeavors.
I. Understanding the Basics:
A. What is an Image Histogram?
- An image histogram is a graphical representation of the distribution of tonal values in an image.
- It provides a visual snapshot of the range of brightness levels, from shadows to highlights.
B. Components of an Image Histogram:
- The horizontal axis represents the tonal range from pure black to pure white.
- The vertical axis measures the frequency or number of pixels at each tonal level.
II. The Anatomy of an Image Histogram:
A. Shadows, Midtones, and Highlights:
- The left side of the histogram corresponds to shadows, depicting darker tones.
- The middle section represents midtones, capturing the main tonal range of the image.
- The right side corresponds to highlights, showcasing brighter tones.
B. Peaks and Valleys:
- Peaks indicate areas of the image with a high concentration of pixels at specific tonal values.
- Valleys represent areas with fewer pixels, creating breaks in the histogram.
C. Tonal Range:
- The width of the histogram indicates the overall tonal range present in the image.
- A wide histogram signifies a broad range of tones, while a narrow one suggests limited tonal diversity.
III. Reading and Analyzing Image Histograms:
A. Balanced Histogram:
- A balanced histogram has a smooth distribution across the tonal range.
- It suggests a well-exposed image with details in shadows, midtones, and highlights.
B. Clipped Shadows or Highlights:
- Peaks or valleys reaching the edges of the histogram indicate clipped shadows or highlights.
- Clipping results in loss of detail in the extreme dark or bright areas.
C. Overexposure and Underexposure:
- An overexposed image may have a histogram with peaks shifted towards the right.
- An underexposed image may show peaks shifted towards the left.
D. High Contrast:
- A high-contrast image may have distinct peaks and valleys, emphasizing both shadows and highlights.
- The histogram reflects the stark difference between dark and light areas.
IV. Utilizing Image Histograms in Photoshop:
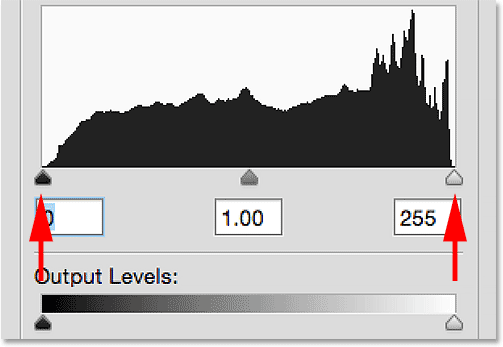
A. Histogram Panel in Photoshop:
- Open the Histogram panel in Photoshop by navigating to “Window” > “Histogram.”
- The panel provides a real-time histogram for the active image.
B. Making Adjustments Based on Histograms:
- Exposure adjustments: Use the histogram to avoid overexposure or underexposure by balancing peaks.
- Contrast adjustments: Alter the distribution of tones to achieve desired contrast levels.
C. Avoiding Clipping:
- Adjust exposure settings to prevent clipping by ensuring peaks don’t reach the edges.
- Use recovery tools or tone mapping for images with clipped shadows or highlights.
V. Advanced Techniques:
A. RGB and Individual Channels:
- RGB histograms display overall tonal distribution, while individual channels (Red, Green, Blue) provide insights into color-specific information.
- Analyzing individual channels aids in identifying color imbalances.
B. Before and After Adjustments:
- Compare histograms before and after adjustments to gauge the impact of changes.
- Ensure that adjustments align with the desired tonal distribution and visual aesthetics.
VI. Troubleshooting and Refinement:
A. Iterative Editing:
- Apply adjustments iteratively, continuously refining based on histogram feedback.
- Regularly check the histogram during the editing process to maintain control over tonal distribution.
B. Histograms in Different Workspaces:
- Understand that histograms may vary depending on color spaces (RGB, CMYK).
- Adjustments in one color space may impact tonal distribution differently.
VII. Conclusion: Empowering Visual Decision-Making
In conclusion, understanding how to read and interpret image histograms in Photoshop is pivotal for making informed decisions during the image editing process. This comprehensive guide has unraveled the intricacies of histograms, from their basic components to advanced techniques, empowering users to decode visual data and achieve optimal tonal distribution in their photographs. As you navigate the expansive world of image editing in Photoshop, the ability to read and understand image histograms emerges as a crucial skill, ensuring that your images are well-exposed, balanced, and visually compelling.